Economic Overview
Divergent policy cycles remained a significant theme in 2015. US authorities responded to improving economic conditions by raising interest rates for the first time in nearly a decade, while central banks elsewhere opted for further stimulus.
China continued to add stimulus to an economy whose growth rate in 2015 fell short of the official 7% target. The Central Bank cut interest rates six times in 12 months and, in August, devalued the yuan by 2%.

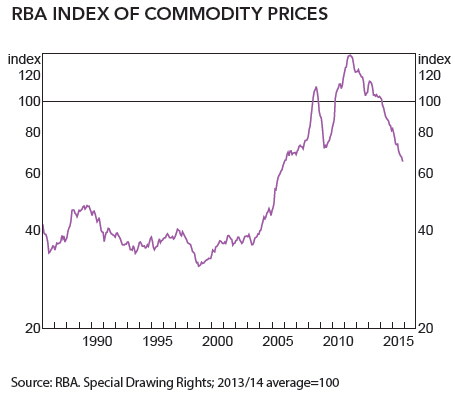
With conditions subdued in Chinese manufacturing and construction and global industrial production weak, commodity prices declined. Iron ore and base metals were particularly hard hit, while oil hit 11-year lows on over-supply concerns.
There were also signs of improvement in Europe, where measures of manufacturing growth and the labour market strengthened through the year. Even so, the European Central Bank extended its quantitative easing program to bolster the recovery.
Below average global growth and falling commodity prices weighed on both the Australian and New Zealand economies in 2015, prompting reductions in official interest rates by their respective central banks.
The RBA cut cash rates twice to 2.0%, the lowest on record and continuing an easing cycle that began in 2011. While the economy expanded moderately in 2015, the bank said there was likely to be fair degree of slack for some time yet.
Australia pushed out its projection for a return to fiscal surplus until 2021, with falling commodity prices and record low wages growth denting income tax revenues.
Slowing global industrial production and demand, particularly out of China, was also cited by official observers as a factor in the wider decline in commodity prices.
Iron ore, Australia’s most valuable commodity export, continued to retreat. The price fell about 45% over 2015 to below $40 a tonne just as major producers were stepping up production from newly completed projects.
Market Overview
Asset Class Returns
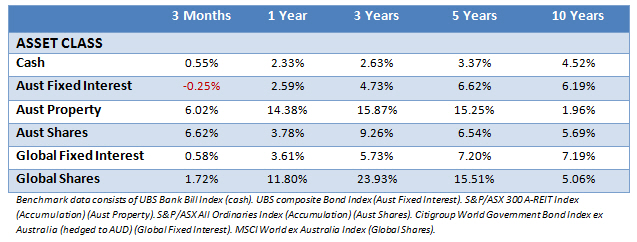
The following outlines the returns across the various asset classes to the 31st December 2015.

Before adjusting for currency, global equity markets as measured by the MSCI World ex-Australia index delivered fairly flat returns in 2015, with investors torn between the influences of an improving US economy and a slowing Chinese one.
This split was highlighted with the divergent performance of developed and emerging markets. The Japanese and some European markets showed strong returns, the US was flat and most emerging markets were significantly negative.
For unhedged Australian investors, returns were much more favourable when denominated in AUD terms.
The ongoing rout in commodity markets was a key influence on equities, holding back resource-heavy markets such as Australia, Canada and Brazil and many emerging markets. The energy sector was the worst hit globally, falling for a second consecutive year.
The Australian market (ASX All Ords Accumulation) posted a modest gain of nearly 4% over the year, held back again by the drag from energy and materials stocks. Utilities, consumer discretionary and healthcare stocks were among the strongest areas.
Unburdened by a significant resource sector, the NZ market again was a global standout, gaining nearly 14% to hit record highs late in the year, with top performing stocks including A2 Milk, Chorus and Nuplex Industries.
THE YEAR IN NEWS
The chart below highlights some of the year’s major news events in context of broad Australian market performance. These headlines are not offered to explain market returns but to show that investors should view daily events from a longer-term perspective and avoid making investment decisions based solely on the news.

Of the asset classes, Australian listed real estate again proved a strong performer in 2015 with a return of over 14% for the ASX 300 A-REIT Index, while cash again lagged the other classes.
With data showing the US economy strengthening and the Federal Reserve raising interest rates for the first time in nearly a decade, the US dollar continued to make headway against other major currencies in 2015.
This reflected in part the divergence in policy cycles. As the Fed tightened, other major economies were still pursuing easier monetary policy.
China surprised markets in August when it devalued the yuan by nearly 2%, blaming a large deviation between the market spot rate and the official daily mid-point fixing.
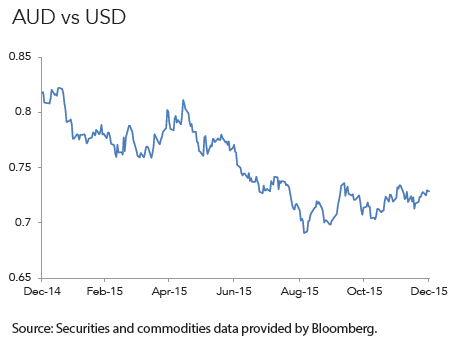
Currencies perceived as being tied to commodity prices were among the weakest performers in 2015. Against the US dollar, the Australian dollar fell by more than 10% over the year.

The Australian’s Top 100 Picks
Every December The Australian newspaper has an end of year feature offering its top 100 financial picks for the year ahead. They generally comprise shares, managed funds, mortgages, credit cards and other financial products.
For the past few years we’ve followed the share picking section of the list with interest – knowing that for the most part, while they will have some success, share pickers will usually fail to beat the market, especially over the long term.
In 2013 The Australian’s 66 share picks offered 31 winners and 35 losers, they combined to provide a 8.86% loss.
In 2014 The Australian’s 65 share picks offered 22 winners and 42 losers and 1 neutral return, they combined to provide a 8.21% loss.
In 2015 we have to tip our hat to The Australian because they finally managed to finish with a positive return.
Possibly smarting from their poor returns from 2013 and 2014, their 2015 list contained only 53 share picks, with the gap being filled by more managed funds and electronically traded funds.
Those 53 share picks offered 20 winners and 33 losers; they combined to provide a 13% return.
Now you’re probably thinking “over 60% of their picks were duds, how did they end up with a positive return?”
Well it came down to one company, Tasmanian Food company Bellamy’s Organic. Bellamy’s rocketed up 724% for the year, as its baby formula flew off the shelves here and in China.
Take Bellamy’s out of the list and The Australian’s picks are back in negative territory for the year. However, that’s not the way it works, so The Australian does deserve credit for producing a 13% return when the wider ASX provided a 0.81% price loss before dividends.
However, it’s worth remembering it’s still only one out of the past three years The Australian has produced a winning year. This is why over the longer term share pickers usually fail to beat the market.
With thanks to DFA Australia.
This material is provided for information only. No account has been taken of the objectives, financial situation or needs of any particular person or entity. Accordingly, to the extent that this material may constitute general financial product advice, investors should, before acting on the advice, consider the appropriateness of the advice, having regard to the investor’s objectives, financial situation and needs. This is not an offer or recommendation to buy or sell securities or other financial products, nor a solicitation for deposits or other business, whether directly or indirectly.


