
Economic Overview
Q2 2024 was a more subdued quarter than some seen recently, with flat to negative returns in many asset classes. Global markets saw small gains with artificial intelligence again providing a strong lead, although a strengthening Australian dollar clipped returns for unhedged investors. As has become the norm, interest around the timing of any potential rate cuts was again a focus in Q2. In the US there were concerns early in the quarter that the economy was overheating, but by the end of the quarter there were hopes of a soft landing again! For its part, the European Central Bank cut interest rates 0.25%. Emerging markets were positive, delivering some of the better returns for the quarter, with some Asian markets the key contributors. Australian shares were in the red, down just over 1% for the quarter while Australian listed property swung back into the red after consecutive double digit positive quarters. Bond returns were also negative in Q2, both locally and globally, with the hedged position of global bonds and the appreciating Australian dollar being the headwind, and concern over further rate increases working against local bond prices.
In the US, GDP came in at an annualised rate of 1.4% in Q1 2024, down on Q4’s 3.4%. This was the lowest annualised figure since Q2 2022, and the slower pace of growth reflected falls in consumer spending, exports, along with local, state and federal government spending. Estimates combined with recent data are suggesting GDP growth around 2% for Q2, which is still above the Federal Reserve’s estimate, currently projected to be 1.8%.
Manufacturing activity, as measured by the S&P Global U.S. Manufacturing Purchasing Manager Index (PMI), fell in April, but rebounded in both May and June, with indicators showing June manufacturing PMI at a three-month high. New orders and employment were positive contributions, along with manufacturing payrolls increasing the most in almost two years. Unfortunately, business optimism fell to the lowest level in 18 months, with concerns around demand and election-related uncertainty, specifically relating to policy.
In June the Federal Reserve held interest rates at 5.25-5.5%, as expected. The decision came in just after Consumer Price Index (CPI) data showed inflation for May was 3.3% year on year. This made it 12 consecutive readings in the 3% range, highlighting the downward trajectory has seemingly stalled. The PCE Price index which is said to be the Federal Reserve’s favoured measure, came in at 2.6%, the lowest reading in three years, but whether it be CPI or PCE, both are well above the Fed’s 2.0% target. Chair Jerome Powell suggested there had been “pretty good progress” on inflation, but would need to see more data before being comfortable with rate cuts. 15 of the 19 members of the federal open market committee still anticipate one to two rate cuts in 2024, against a prior forecast of three. The market and traders are still anticipating two cuts before year end.
Job growth exceeded expectations in May, with the labour market continuing to be more robust than expected, adding an average of 248,000 net new jobs each month through May. However, the unemployment rate has crept up to 4% from 3.5% at the end of 2023. It should be noted that 4% is still historically low.
Evidence suggests US consumers are becoming more selective about discretionary spending. Q1 data showed consumer spending on goods declined by 2.3% compared to Q4, with durable goods experiencing a 4.5% decline. This was the steepest drop since Q3 2021 when pandemic-related stimulus payments were disappearing. Non-durable goods spending also fell 1.1%, but spending on services was robust, rising 3.3% in Q1. The use of consumer credit is also easing, only rising by 1.9% for the year ending in April 24. Total consumer debt stood at $17.6 trillion, with mortgage debt around 70% of that number. The majority of that debt is on fixed rates, much lower than new loans, leading to many consumer balance sheets being more resilient in the face of prior rate hikes.
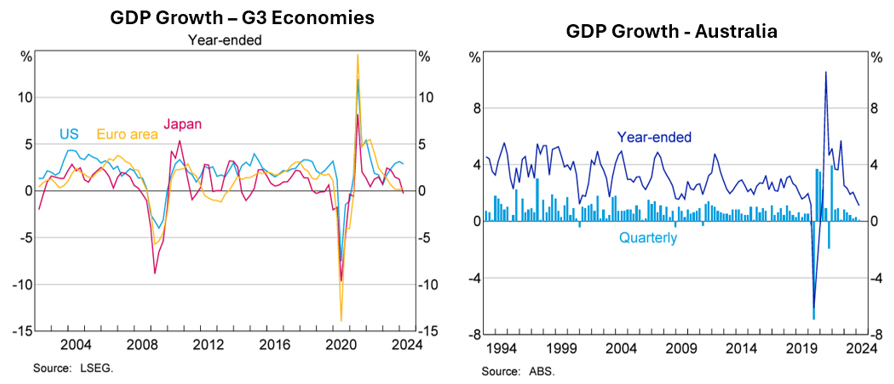
Source: RBA 2024
In the Eurozone, despite European Central Bank President Christine Lagarde previously playing down rate cuts, the ECB cut interest rates by 0.25% in June. However, the potential for further cuts may be limited by sticky inflation. Annual inflation in the eurozone was 2.6% in May, up from 2.4% in April. The Q1 GDP reading came in at 0.3%, with a 1.3% annualised figure. Germany saw 0.2% growth for Q1, an improvement on the revised -0.5% figure of Q4, while France 0.2%, Spain 0.8% and Italy 0.3% all saw positive readings for Q1. The flash composite purchasing managers’ index fell to 50.8 in June from 52.2 in May. However, the June reading was still improved on the monthly figures from Q1 which were under 50. The major focus in Europe across the quarter was politics, with European parliamentary elections seeing gains for right-wing nationalist parties. This was notably the case in France. French President Macron responded by calling parliamentary elections.
In the UK, after a mild recession in the second half of 2023, data showed a bounce back in Q1 GDP with 0.7% growth. Unfortunately, Q2 was looking more stagnant with the three-month unemployment rate (ending April) rising to 4.4%, with 140,000 jobs lost. On the inflation front, CPI fell back to 2.0% in May, the first time it had been inline with the Bank of England’s target since July 2021. Despite this, the BoE kept interest rates at 5.25%, as there were concerns the fall in UK inflation may only be temporary, and high wage inflation will increase the rate of inflation in services. The UK was another country where politics took centre-stage, with Prime Minister Rishi Sunak calling a general election to be held on July 4.
In Japan, Q1 GDP came in at -0.5% quarter on quarter, with an annualised rate of -1.8%. Annual monthly inflation has remained in the 2’s with May’s reading sitting at 2.8%. One of the main stories of note was the ongoing weakness in the yen, as it spent the whole quarter in a downtrend against the US dollar, and has been consistently depreciating since early 2021. The ongoing weakness saw the yen hit its lowest point since the mid 80’s. The Japanese government and the Bank of Japan expressed concerns about the impact of yen weakness on inflation. Wage growth remained negative as the slow increase in wages has not yet surpassed the level of inflation and has resulted in stagnant consumer sentiment in 2024. The weak yen has seen a record-high number of international tourists, which has supported consumption.
In China, GDP growth for Q1 came in at 1.6%, this was the seventh consecutive period of quarterly growth and the strongest figure since Q1 2023, the boost was said to be related to the Spring festival. China’s statistics agency noted that the recovery in the economy will continue as Beijing intends to strengthen their macroeconomic policies and pursue high-quality development. The GDP growth target for 2024 is 5%, but there will be headwinds. The property sector remains in a malaise and the economy relies on manufacturing while still needing to transition more to consumption. Trade tensions remain a concern, with the EU poised to add additional tariffs of up to 38% on Chinese electric vehicles.
In Emerging Markets, there were several key elections, in South Africa investors welcomed election results that saw the African National Congress Party and Democratic Alliance, with a group of smaller parties, form a coalition “Government of National Unity”. In India Prime Minister Modi’s Bharatiya Janata Party (BJP)-led National Democratic Alliance retained its majority although the BJP lost its single party majority. In Mexico, Claudia Sheinbaum’s election as president, along with her Morena party’s super majority in the lower house, has raised some concerns if Morena is able to pass constitutional and judicial reforms. There was also concern in Mexico as the central bank flagged caution on future interest rate cuts. While Brazil bounced back with 0.8% GDP growth in Q1 after contraction in Q4, flooding in the southern state of Rio Grande do Sul, saw concerns about economic growth, fiscal spending and inflation.
Back in Australia, data released in June showed GDP increasing by 0.1% for Q1 2024, down on the Q4 figure of 0.3%, with the economy growing by 1.1% year on year. GDP per capita, noted as a proxy for living standards, again fell over the quarter again, down -0.4% and was down -1.3% year on year. Inflation bounced on a quarterly basis, with CPI coming in at 1.0% for Q1. For the 12 months to March CPI came in at 3.6%, but above market expectations of 3.4%. There was moderation in food, alcohol and tobacco, housing, health and transport, while education, clothing and household services were up on the previous quarter.
The RBA held the cash rate at 4.35% at it’s May and June meetings. The RBA noted in its June meeting that “the case to hold the cash rate steady at this meeting was based on the view that the economy was still broadly tracking on a path consistent with returning inflation to target in 2026, while preserving as many of the gains in employment as possible”. The household savings rate dipped under 1% in Q1 after the bounce seen in Q4 2024. In the four years pre-covid, the quarterly savings rate averaged 5.8%.
House prices continued to increase in most markets during Q2 24, and across the 12 months ending June. The combined capitals were up 1.8% and combined regionals were up 1.9% for the quarter. Sydney was up 1.1% for the quarter and 6.3% annually, according to CoreLogic. The two capitals to see falls were Melbourne -0.6% and Hobart -0.3%, the pair were also the weakest capitals annually, Melbourne up 1.3% and Hobart down -0.1%. Interestingly, both Melbourne and Hobart peaked in March 2022, with Hobart down -11.7% since and Melbourne down -3.9%. In a reminder that house prices can go nowhere for a long time (even in Australia) Darwin still sits -5.7% below its peak of May 2014.
Annual rental growth slightly eased to 8.2%% across the country. The largest increases in rents were seen in Perth, with both house and unit rental increases over 13%. The lowest rental growth was seen in Hobart, with house and unit rents up 2.2% and 1.1% respectively.
Market Overview
Asset Class Returns
The following outlines the returns across the various asset classes to 30 June 2024.

Global sharemarkets were mixed to positive in Q2 with the US providing the lead. However, as earlier noted, the appreciating Australian dollar was a handbrake on unhedged returns. The hedged version of MSCI World ex Australia saw a 2.95% return for Q2, while the unhedged version squeezed out a 0.28% return. The Australian market was down -1.16% for the quarter, while Australian listed property fell back with a -5.66% loss after a year of strong gains. Bonds were down in Q1 as yields increased, with the market suspecting rate cuts coming later rather than sooner. The 10-Year US Treasury yield moved upward in Q2, from 4.20% to finish at 4.40%. US 2-year yields were also up slightly during Q2, up from 4.63%, to finish at 4.77%. In the UK, the 10-year yield lifted from 3.94% to 4.17%. In Australia the 10-year yield moved up from 3.98 to finish at 4.32%, while 2-Year government bonds took off from 3.77% to 4.17%.
In the US, the S&P 500 was up 4.28% for the quarter and the index notched another 8 new highs in Q2. Across the first half there was a notably lower level of market volatility. The S&P only experienced seven trading days with declines of greater than 1%, and by June 30 the market had notched 340 trading days without a decline of 2% or more on a trading day. While things have been rosy for large caps, the small-cap Russell 2000, was down -3.28% for the quarter and is now lagging the S&P 500 by 13.56% year to date.
The second quarter saw the majority of gains narrowed down to a select couple sectors again. After Q1, eight sectors were closely tracking the S&P 500’s gain for the year. After Q2, information technology and communication services were ahead of the index by at least 10%, while every other sector now lags the S&P 500 for the year. The ongoing tech rally has significantly increased the valuation of Nvidia, Microsoft, and Apple, now worth almost $10 trillion combined. This was the value of the entire S&P 500 back in 2010!
In the Eurozone, sharemarkets moved lower in Q2 with the MSCI EMU down -1.74%. The markets fell amid uncertainty caused by the announcement of parliamentary elections in France, where the CAC 40 was down -8.84%, along with dwindling expectations for ongoing interest rate cuts. The German DAX 30 was down -1.39%. Like many other markets, the information technology sector gained with semiconductor-related stocks performing particularly well. The consumer discretionary sector saw declines through weakness in automotive and luxury goods companies.
In the UK, sharemarkets made decent gains with the FTSE 100 achieved all-time highs in May before easing towards the end of Q2 to notch a 2.70% gain. Performance of small and mid-sized companies also saw some bids, with the mid cap FTSE 250 up 2.02%, and UK small caps delivered a healthy 5.30% after a slight Q1 loss. These market segments were supported via expectations of a possible turning point for domestically-focused companies following a decade of underperformance. While it was a strong quarter in the UK, some gains were given back in June as expectations for rates cuts were pushed out.
In Japan, it was a mixed quarter with the large cap Nikkei 225 index down nearly 2% after a 20% gain in Q2, while the broader TOPIX Index was up 1.7% in Japanese yen terms. However, due to the continued depreciation of the Japanese yen, the foreign currency-based return was in the red. The second quarter e full-year earnings season, and it ended with stronger than expected results. There was increased sales growth, pricing power, and cost control, across the board which helped corporate profitability. Even with these positives, market sentiment struggled due to conservative earnings guidance from many companies for the new fiscal year.
Asia (ex-Japan) and Emerging markets delivered some solid gains in Q2, MSCI AC Asia ex Japan was up 4.72%, while the MSCI Emerging Markets Index was up 2.57%, both in Australian dollars for the quarter. Taiwan, India, and Singapore were the best-performing markets in the MSCI AC Asia ex Japan Index in Q2, while Indonesia, the Philippines, and Thailand were the worst. China also saw decent gains after a few months of underperformance, as low valuations encouraged Asia-focused investors to look towards the Chinese market again due to concerns over India’s stretched valuations and Japan’s weakening currency. There was also positive sentiment in China due to support for the housing sector and President Xi’s reform rhetoric. Taiwan was the best-performing index market for the quarter, again thanks to investor optimism over artificial intelligence. Hungary, the Czech Republic and Poland did well, but some of the energy heavy markets such as Kuwait, UAE, Colombia and Saudi Arabia underperformed, as did Brazil and Mexico.
The Australian market (All Ords Accumulation) was down -1.16% in Q2. Half of sectors were in the red and not even a 3.99% gain from the heavyweight financial sector could drag the index into the green. The best sector for the quarter was utilities at 13.27%, with Origin and several other listed electricity generators/retailers across Australia and NZ continuing to see strong returns. IT and health care also delivered positive returns, while industrials and consumer staples were slightly up. Materials and energy were the worst performers, followed by listed property. The big miners, BHP, Rio Tinto and Fortescue were all down as the iron ore price fell, recovered through May, then fell again in June. Woodside Energy also fell through most of the quarter with the weakening oil price. Finally, the ASX small ordinaries finished down -4.46% for the quarter, a further drag on more diversified portfolios, which mirrored the small cap malaise in the US.
This material is provided for information only. No account has been taken of the objectives, financial situation or needs of any particular person or entity. Accordingly, to the extent that this material may constitute general financial product advice, investors should, before acting on the advice, consider the appropriateness of the advice, having regard to the investor’s objectives, financial situation and needs. This is not an offer or recommendation to buy or sell securities or other financial products, nor a solicitation for deposits or other business, whether directly or indirectly.