
Economic Overview
Q3 2024 saw decent gains across all asset classes, with fixed interest relatively strong as rate cuts helped to drive up bond prices. Global stocks saw smaller gains with the strengthening Australian dollar again proving a headwind for unhedged investors. After months, even years, of speculation about rate cuts in the US, the Federal Reserve finally moved during the quarter. This was off the back of evidence that inflation was continuing to moderate, and the jobs market showing signs of softening. The Bank of England and Bank of Canada also came to the rate cuts party in the quarter. Emerging markets were again strong, starting to recover previous highs seen prior to Russia invading Ukraine, with Chinese stimulus measures playing a role in emerging market gains. Australian shares recovered from their small Q2 loss to notch a high single digit return, the best since Q4 23, while Australian listed property was sharply up, into double digits, and now significantly above its pre covid highs. Bond returns were also strong in Q3, both locally and globally as more central banks cut rates and markets priced in further cuts in the near future.
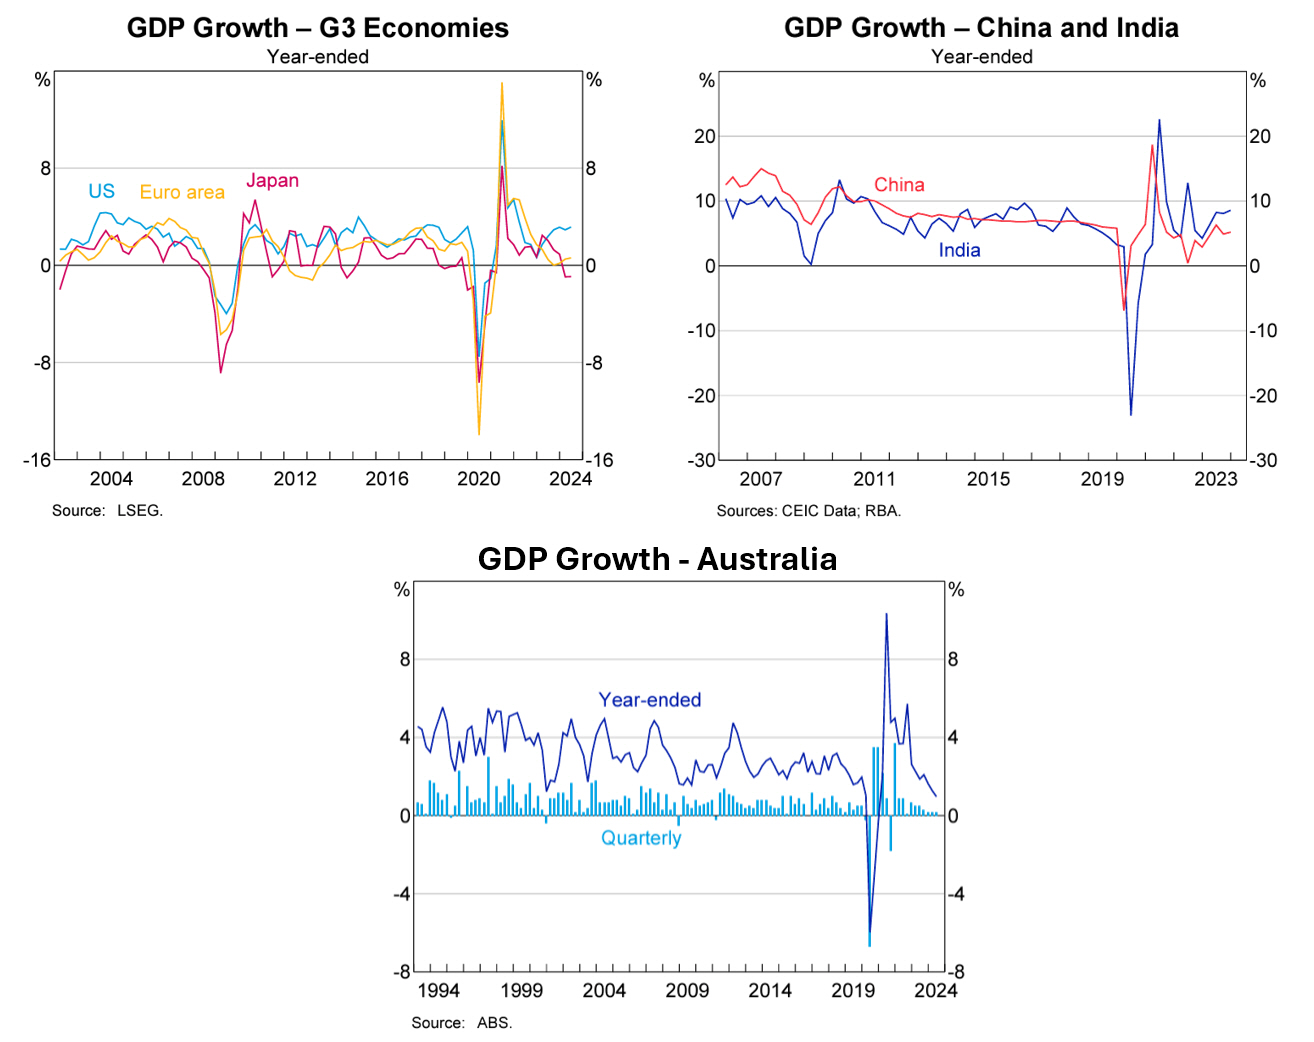
In the US, GDP came in at an annualised rate of 3.0% in Q2 2024, significantly above Q1’s revised figure of 1.6%. Consumer spending growth has been resilient, up in Q2 by 2.8%, this was driven by a bounce in spending on goods. While fixed investment slowed from Q1, equipment spending remained robust, rising by a seasonally adjusted annualised 9.8%. After two negative quarters, inventories rebounded, adding 1.05% to growth. Some contributors were private goods-producing industries, increasing 6.9%, private services-producing adding 2.4%, and government increasing 0.8%. The Bureau of Economic Analysis also offered GDP revisions for 2022 and 2023, with 2023 GDP growth revised up to 2.9% from 2.5%, and 2022 revised up to 2.5%, 0.6% higher than previous figures.
Manufacturing activity, as measured by the S&P Global U.S. Manufacturing Purchasing Manager Index (PMI), fell to 47 in September, down from 47.9 in August. This was the third consecutive month of contraction in US factory activity after positive moves in Q2. A large decline in new orders for goods, the largest since December 2022, was behind the drop, highlighting a pessimistic outlook for US goods producers, which drove production to decline for a second straight month.
Interest rate expectations were again a dominant theme through the quarter. The Federal Reserve left rates on hold in July, but early August came with weaker jobs data. Non-farm payrolls showed 114k jobs were added in July, this was below the expectations of 175k, as the unemployment rate moved up to 4.3%. The data led to concerns the Fed may have left it too late to cut interest rates and markets started to price significant monetary policy easing by year’s end. The first cut came in September as the Fed reduced the benchmark rate by 0.5% to counter a potential labor market slowdown. Eleven of twelve voting members backed the decision, bringing the federal funds rate to a range of 4.75% – 5%.
The post meeting statement suggested the Committee has confidence inflation is moving toward 2%, and the likelihood of hitting its employment and inflation goals are in balance. Bond markets continue to price in further total cuts of 0.75% for the rest of 2024. US inflation as measured by CPI, came in at 2.9% in July, falling to 2.5% in August. These were the first readings in “the twos” since March 2021.
U.S. retail sales rose 0.1% month on month in August, with the July figures revised up to 1.1%. New York Fed data showed total consumer debt rose by $109 billion in Q2 to a high of $17.8 trillion, and consumer credit is on the rise, up $25.4 billion in July. This marked the largest credit growth since November 2022. The sharp increase rise in consumer borrowing signals strong demand for credit despite ongoing economic uncertainties. Notably, workers have seen an increase in wages, up 3.8% year on year, giving a real increase after inflation.
The other major news for the quarter was President Joe Biden withdrawing from the Presidential race, with Vice President Kamala Harris to face Former President Donald Trump in November’s election.
Source: RBA 2024
In the Eurozone, The European Central Bank held interest rates in its July meeting, but then cut by 0.25% in September. Data showed inflation easing across the period, with annual inflation falling from 2.6% in July, to 2.2% in August, and 1.8% in September. Activity indicators pointed to a slowdown in the EU economy. The flash eurozone purchasing managers’ index (PMI) for September came in at an eight-month low of 48.9. With an ongoing downturn in the manufacturing sector behind the reduction in activity, while service sector activity increased slightly with a reading of 50.5. Weaker PMI data, along with lower inflation readings, increased expectations of further rate cuts in the near future. On the political front, a nationalist and anti-immigration sentiment is growing across Europe. After President Macron dissolved the French parliament in June, calling snap elections to head off the surging anti-immigration National Rally party, those elections concluded in July with no grouping achieving an outright majority. In September, Macron appointed centre-right politician Michel Barnier as prime minister.
In the UK, a landslide election win by Labour at the start of Q3 fuelled hopes for a sustained recovery in the domestic economy. In August the Bank of England delivered the first cut in four years, the bank’s governor Andrew Bailey promised to move ahead cautiously with further cuts, while deputy governor Clare Lombardelli added the base case for inflation remains benign, but there are risks that inflation could move higher again. Positive sentiment was offset by new UK Prime Minister Keir Starmer suggesting a “painful” autumn budget was coming. Potential tax increases and spending cuts were flagged, due to an estimated £22 billion shortfall. The Office for National Statistics subsequently revised Q2 growth down to 0.5%, a step lower than the 0.7% quarter-on-quarter growth achieved in Q1. Inflation figures also disappointed, as annual CPI ticked up slightly to 2.2% after hitting the bank’s 2% target in June.
In Japan, Q2 GDP came in at 0.7% quarter on quarter, up on the downwardly revised -0.6% figure of Q1. After being flat at 2.8% May to July, annual inflation increased to 3% in August. The Bank of Japan moved on interest rates during Q3, increasing rates from 0.1% to 0.25% in July, and this was something of a surprise. Combined with US rate cuts, these changes caused a significant swing in the currency market, with the yen sharply strengthening against the US dollar. Real wage growth, after inflation, turned positive for the first time in over two years during Q3, with both August and September delivering positive wage growth.
In China, GDP growth for Q2 came in at 0.7%, notching the eighth consecutive period of quarterly growth, albeit down on the downwardly revised Q1 figure of 1.5%. Year on year Chinese GDP sat at 4.7% for Q2. The big China news came in September, when the People’s Bank of China announced a new stimulus measures to boost their struggling domestic economy. The PBOC had announced similar, albeit smaller scale measures earlier in the year without much fanfare, but the scale of this round caught the market’s eye, sending Chinese stocks surging. This time, rates were cut 0.5%, bank reserve limits were lowered to encourage lending, while the bank also said it would ease restriction on borrowing to investing in Chinese shares. From an economic standpoint, it remains to be see if the latest stimulus package has the desired effect on the economy.
In Emerging Markets, Thailand saw delivery of the first stage of a government stimulus package in September. In South Africa, elections concluded with the formation of the Government of National Unity (GNU), while the central bank followed the Federal Reserve’s lead in September by cutting interest rates for the first time since 2020 as Q2 annual growth came in at 0.3%. Brazil’s central bank reversed recent monetary policy by raising rates to contain inflation, while the government increased fiscal spending. Mexico saw a rate cut, as uncertainty over judicial reforms continued to weigh, with annual growth at 2.1%. Turkey saw its lowest year on year growth in four years at 2.5%. Overall, the cut in US interest rates was seen as a positive for emerging markets.
Back in Australia, data released in September showed GDP increasing by 0.2% for Q2 2024, with the economy growing by 1.5% for the year ending June. GDP per capita, noted as a proxy for living standards, again fell over the quarter again, down -0.4% and was down -1.5% year on year, marking the sixth consecutive quarter it has gone backwards. Inflation held on a quarterly basis, with CPI coming in at 1.0% for Q2, and for the 12 months to June CPI came in at 3.8%. This was largely inline with market expectations. Inflation in food was unchanged, but specifically meat and seafood prices eased over the year, along with furnishings, household equipment and travel and accommodation. Non alcoholic beverages, tobacco, housing, electricity and clothing were all up.
The RBA held the cash rate at 4.35% in it’s August and September meetings. The RBA noted in its September release that “while headline inflation will decline for a time, underlying inflation is more indicative of inflation momentum, and it remains too high.” Further, “data since then (August) have reinforced the need to remain vigilant to upside risks to inflation and the Board is not ruling anything in or out. Policy will need to be sufficiently restrictive until the Board is confident that inflation is moving sustainably towards the target range.” The household savings rate held at 0.6% in Q2 after the dipping under 1% in Q1 2024.
House price growth slowed over the quarter, with several markets seeing declines in quarterly figures, but most were still in the green for the 12 months ending September. The combined capitals were up 1.1% and combined regionals were up 1.0% for the quarter. Sydney was up 0.5% for the quarter and 4.5% annually, according to CoreLogic. Melbourne -1.1%, Hobart -0.8%, Darwin -0.7% and Canberra -0.9% were capitals to see falls over the quarter, while Melbourne -1.4% and Hobart -1.1% were the two capitals to see falls over the year. Hobart is now down -12.5% since its peak, while Melbourne is down -5.1%. Darwin now sits 6.0% below its peak of May 2014. Rental growth eased significantly over the quarter, with Sydney, Brisbane and Canberra all seeing a reduction in rents, while Melbourne and Perth only saw small increases.
Market Overview
Asset Class Returns
The following outlines the returns across the various asset classes to 30 September 2024.
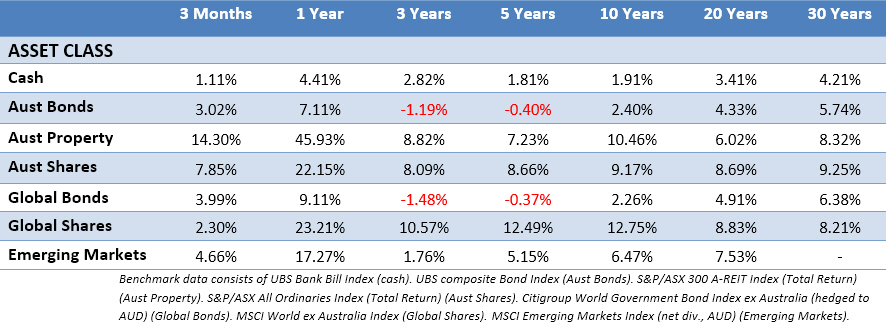
Global sharemarkets were healthy over Q3, with the US again offering strong returns in both large and small caps. However, the appreciating Australian dollar was again a handbrake on unhedged returns for Australian investors. The hedged version of MSCI World ex Australia saw a 4.43% return for Q3, while the unhedged version saw a 2.30% return. The Australian market was up 7.85% for the quarter, while Australian listed property screamed ahead with a 14.30% gain, to be up 45.93% year on year. Keeping this in context, the index saw hefty falls in 2022 as interest rates started increasing. Bonds were strong in Q3 as rates cuts (and the expectation of more to come) landed in several major markets, trimming yields, but pushing up prices. The 10-Year US Treasury yield fell across Q3, from 4.40% to finish at 3.78%. US 2-year yields fell during Q3, down from 4.77%, to finish at 3.64%. In the UK, the 10-year Gilt yield fell from 4.17% to 4.00%. In Australia the 10-year yield fell up from 4.32% to finish at 3.84%, while 2-Year government bonds fell from 4.17% to 3.65%.
In the US, the S&P 500 was up 5.89% for the quarter, and after lower levels of volatility in the first half of the year, there were 20 trading sessions with movements greater than 1% in Q3. Overall, the S&P 500 is up 22.08% ending September. Some big moves came from the small cap space during the quarter, with the Russell 2000 up 9.27%. Although this now accounts for most of its year-to-date gains, as it has been lagging the S&P 500 across 2024. Falling rates offered a boost to interest-sensitive sectors like utilities, real estate, industrials, and financials. Utilities posted a 19% return for the quarter, now up more than 30% for the year, however they are the smallest sector of the S&P 500. Real estate, which was negative year-to-date through June, saw a 14% gain after the third quarter, while industrials and financials both posted double-digit gains in the quarter. Technology and communications lagged in the quarter, both up around 1%. This was reflected in the tech heavy Nasdaq index, only up 2.76% for Q3. The Magnificent 7 (Apple, Amazon, Alphabet, Meta, Microsoft, Nvidia, and Tesla) struggled during the quarter with five of the seven seeing falls. S&P 500 earnings are expected to grow around 18% in 2024, excluding the Magnificent 7 it’s expected to be a 14% earnings increase.
In the Eurozone, sharemarkets moved up in Q3 with the MSCI EMU up 3.07% in EU terms. Similar to the US, the gains were led by real estate, utilities and healthcare sectors as the prospect of lower interest rates saw investors turn their attention to the overlooked and rate sensitive sectors. In France, where the markets have been mostly treading water across 2024 with political uncertainty, the CAC 40 was up 2.08%, getting a boost from the late quarter ECD rate cut, while the German DAX, now into double digits year to date, was up 5.97% in Q3. Energy and information technology were the main European laggards, both in the red for the quarter.
In the UK, sharemarkets were flat to positive for the quarter depending on size. The large cap FTSE 100 notched a 0.88% gain. Small and mid sized companies saw better returns, with the mid cap FTSE 250 up 3.78%, and UK small caps were up 3.18%. Consumer staples, financials and consumer discretionary sectors were the better performers over the period. Energy was a significant drag. Listed renewable energy assets were also strong performers with the expectation of further rate cuts, and the perception of a supportive political environment following Labour’s election win.
In Japan, it was a wild quarter with exceptionally high volatility in Japanese markets. In early July the Nikkei reached a record high due to ongoing positive momentum and a weak yen. However, the market then corrected sharply for a fortnight, before a significant event occurred in early August, as weaker US economic data collided with the Bank of Japan raising interest rates. The rapidly strengthening yen led to a massive market sell-off where Japanese large caps fell 20% in less than a week. However, by mid August, the market was higher than it was three weeks earlier! This market behaviour serves as a reminder, with stocks volatility can always be around the corner, but there’s a benefit in having the discipline to look through it and focus on the long-term.
Asia (ex-Japan) and Emerging markets again delivered good gains in Q3, the MSCI AC Asia ex Japan Index was up 6.53%, while the MSCI Emerging Markets Index was up 4.66%, both in Australian dollars. Thailand, Hong Kong, and China were the best-performers in the MSCI AC Asia ex Jpn Index, while South Korea and Taiwan were the worst-performers. This was due to the sell-off in tech stocks, with investors beginning to question how artificial intelligence might benefit revenue. The Korean won also appreciated which weighed on export-oriented shares. Taiwan was also hit by the tech stock sell off, with AI stocks specifically hit, despite this, Taiwan still remains one of the best-performing indices this year. China saw strong gains due to the announced stimulus measures. South Africa was strong on the formation of the Government of National Unity (GNU), and as the central bank cut interest rates. India and Brazil underperformed, with the latter negatively affected by the central bank reversing recent monetary easing by raising rates to contain inflation. Colombia lagged its emerging market peers amid a weaker oil price.
The Australian market (All Ords Accumulation) was up 7.85% in Q3. Nearly every sector managed a positive return, with IT bucking the trend seen elsewhere and leading the way with a 15.27% return, followed by listed property. Materials, consumer discretionary and industrials all saw double digit returns. The large miners saw strong moves towards the end of the quarter with the Chinese stimulus announcement, pulling materials upwards. Financials delivered an 8.30% return, as the banks, particularly CBA, continue to enjoy a strong year. The laggards were utilities, in contrast to other markets, and energy, which was inline with all other major markets. The oil price spent much of Q3 in a downward trend, with both WTI and Brent crude going under $70 a barrel in September, WTI closed out the quarter sub $70. Finally, the ASX Small Ordinaries didn’t outpace their larger counterparts, as was the case in other developed markets, but they still finished up a healthy 6.53% for the quarter.
This material is provided for information only. No account has been taken of the objectives, financial situation or needs of any particular person or entity. Accordingly, to the extent that this material may constitute general financial product advice, investors should, before acting on the advice, consider the appropriateness of the advice, having regard to the investor’s objectives, financial situation and needs. This is not an offer or recommendation to buy or sell securities or other financial products, nor a solicitation for deposits or other business, whether directly or indirectly.