Safe Haven
“It could be set and forget previously, but while some of that is still happening, people are making a conscious decision nowadays to invest in cash,” Australian Financial Review, June 20 2012
Economic uncertainty has been plaguing investors for longer than the past five years. If you were to go back in history you’d find oil embargos, the dismissal of governments, controversial taxes, market crashes, major company collapses, wars, currency crises, terrorist attacks, tsunamis and nuclear meltdowns. Each event is inevitably accompanied by uncertainty, this consequently impacts financial markets.
Throughout these uncertain times investors have been confronted with choices not unfamiliar to today. Do they continue to invest across a broad range of growth and defensive assets when uncertainty strikes, or do they flee to an implied safe haven until they feel confident to invest again?
Mention investment ‘safe haven’ and inevitably cash will come to mind. Yet ‘safe haven’ is little more than a throwaway term given to an asset class investors flee towards when they feel nervous. There’s never been a consistently safe investment haven, and if there was, history shows cash certainly hasn’t been it.
The past 30 years have endured considerable volatility and economic uncertainty. So it’s worth investigating how the logic of cash as an investment safe haven would have fared against the returns from different portfolio configurations.
Avoiding the risk contained in even a balanced portfolio would have cost an investor an extra 2.5% a year. And with an initial investment of $10,000, the end result is an investor costing themselves an extra $111,233 across that 30 year period.
The longer term merits of diversifying across asset classes to capture gains and buffer losses are easy to understand in hindsight. However, over a shorter time frame discipline can be lost and investment strategies questioned when portfolios don’t perform as expected. So how would a cash investor have fared decade to decade?
And this wasn’t a decade without incident. The US had the Savings and Loan crisis, Australia had the introduction of Capital Gains & Fringe Benefits tax, world sharemarkets crashed by over 40% in 1987, there was an Australian recession, BondCorp collapsed at the beginning of the 90’s, while the first Gulf War started in 1991.
Amidst this ongoing uncertainty around the world, the temptation to ride out these events by playing it safe and staying in cash must have entered the mind of every investor, but as the returns show, this strategy wasn’t a riskless proposition.
A balanced portfolio outperformed cash by 4% per annum over the ten year period, resulting in a $16,063 higher return – a significant difference when the cash return itself was only $38,939.
Japan went into recession after phenomenal economic growth, Asia had a currency crisis, a GST was introduced in Australia, the dot-com bubble burst and finally there were the 9/11 terrorist attacks.
Again, cash trailed a balanced portfolio by an annualised 3.4% over the ten years. For the investor, staying in the safe haven of cash meant a $6,812 lower return.
It’s here that an all cash strategy begins to show appeal. Cash ends the decade neck and neck with a balanced portfolio, but it has to be asked – would liquidating a portfolio in moments of fear and rushing to cash actually achieve anything?
While it may have felt safe, the rush to cash does incur some penalties. Firstly, there’s the crystallisation of capital gains and the loss of franked distributions, all while ensuring future income is taxed at an investor’s marginal rate. It would also limit an investor to a single asset class that regularly trails all other asset classes over the longer term.
This comparison has served to ignore two other components of most portfolios – two asset classes that have been performing comparatively well from the beginning of 2010.
As investors have swarmed to cash, fixed interest and listed property have started to offer greater returns. Unfortunately, the returns of fixed interest and listed property have largely been missed by the media, again creating the false dilemma of cash versus equities and ignoring the greater asset spread in a balanced investment portfolio.
Further contributing to conservative investor choices at the moment are thoughts clouded by recency bias. This is when our expectations for the future are based on recent history. In this case, the assumption that because cash has shown comparable – and often better returns – than other asset classes over recent history, that it will continue to do so.
The curse of recency bias has already reared its head in 2012, with investors still fleeing to cash while cash is being outperformed by all other asset classes.
The Future
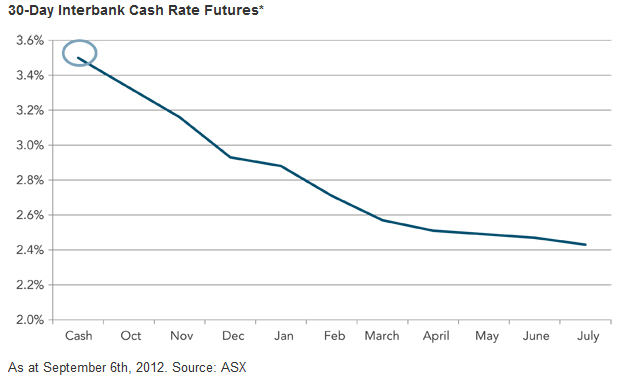
Interest rate expectations can be gauged by the 30-day interbank cash rate futures traded on the ASX. Since early September the market has been pricing in cuts to the official rate, with the expectation of a possible 0.5% cut this year – 0.25% already cut – and another 0.5% cut next year. That would put rates at 2.5% by mid 2013.
While investors could still expect a better rate at the bank, if this trajectory is correct, it would appear cash won’t be shedding its long term tag of the worst performing of all asset classes.
This isn’t to suggest cash doesn’t have value. It remains an important component of any portfolio because it provides liquidity. And if you’re looking to park money short term, cash is the sensible option because you’ll be protected from any market falls. However, there’s no long term reasoning behind being wholly invested in cash; the lack of capital growth, the spectre of inflation and the taxman waiting for his cut should ensure that.
Cash may continue to rule the investment landscape for short spaces of time, but over the longer term, the continuing risk of forgoing higher returns reveals cash as being less than regal.
Assumptions


