It seems like a long time since February 10. If you can’t remember it, here are two reminders from the Australian Financial Review:
ASX slides into bear territory; 4600 looms
ASX succumbs to bear market contagion
That was the most recent market bottom. This week the AFR was printing very different headlines:
Rally in US brings out the ASX ‘s raging bulls
ASX records gains for a sixth straight week
If your outlook is long term, or your focus is income, both sets of headlines are equally meaningless. What happens in February 2016 or May 2016 should be regarded as irrelevant when it comes to your long-term investment strategy. Yet for some investors that first set of headlines (and the market action behind them) prompts a nervous reconsideration of their strategy.
On cue in February, as the market was hitting its 2016 lows, a letter to AFR’s advice column appeared.
My wife and I are self-funded retirees. Our only source of income in retirement is our self-managed super fund. The SMSF is currently structured with about 20 per cent cash and the remainder split evenly between two managed funds. I’m wondering where we should go from here, being such volatile times and should we be looking at more of a 50:50 cash-managed funds structure?
Firstly, it seems the retiree’s problem can be traced to his lack of diversification. Limited to two managed funds (we’ll assume equities given his concern) and 20% left in cash, it appears the volatility from this structure has overwhelmed him. He would have seen both of his funds decline over 10% in the space of 40 days. The letter to the AFR was his panicked response.
Too much in equities, no fixed interest and too much in cash. Common mistake. However, any investor happy to accept this type of volatility will enjoy some spoils when the market is roaring. It’s not for everyone though, but no matter how your investments are structured it’s important to keep the short term in perspective.
Here’s the growth of $1 invested into four different portfolios from January to April this year. 70/30 represents the most defensive with the least equity exposure, while 5/95 represents the most aggressive with the most equity exposure.
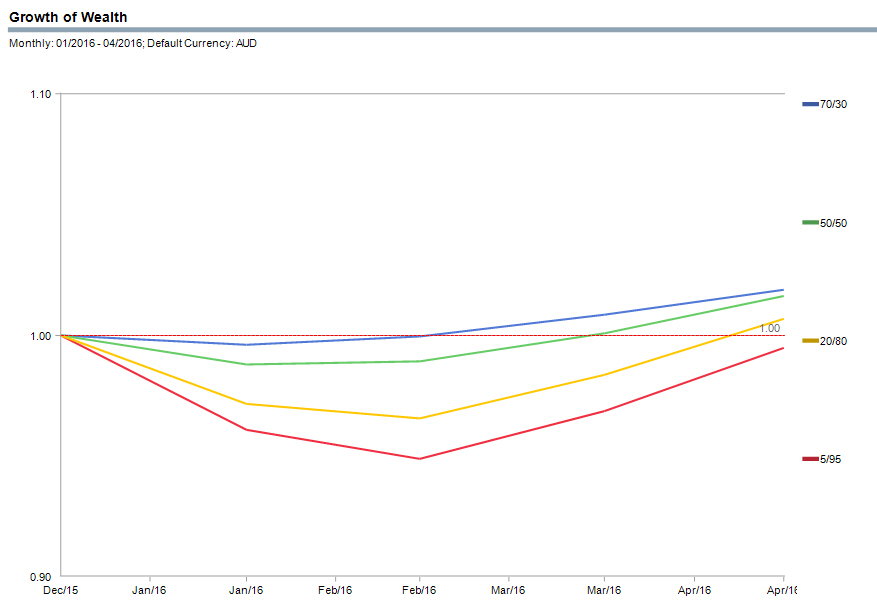
During this year’s volatility 70/30 was the best performing portfolio. Though as you’ll notice, the wide margin it was ahead of the other portfolios in February has begun to evaporate. And with equities surging throughout May it’s likely the 70/30 portfolio is no longer leading returns for 2016.
This is illustrated by behaviour of the same portfolios over a longer time frame, in this instance since January 2000, again using the growth of $1.
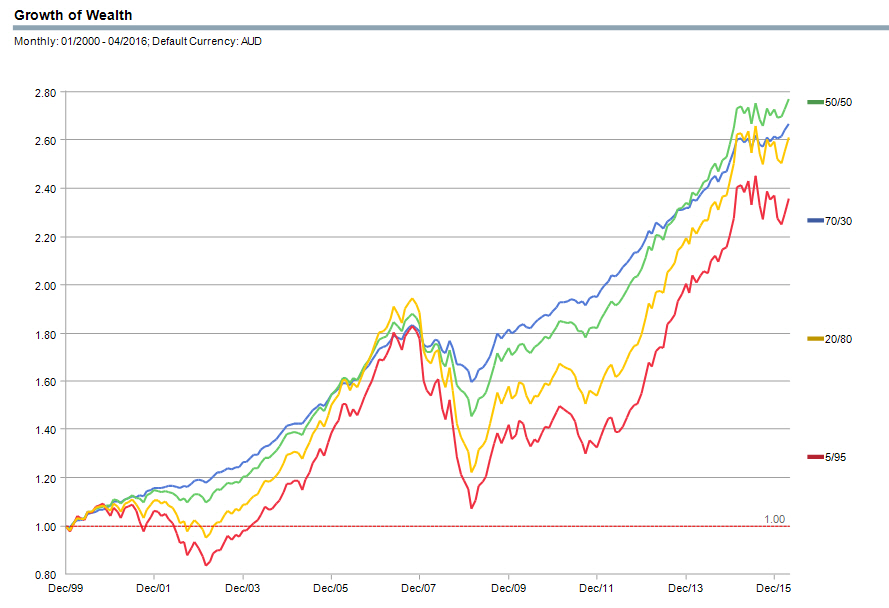
After 15 years encompassing terrorist attacks, tsunamis, dotcom bubbles bursting, a global financial crisis, a US ratings downgrade and the end of a mining boom, we should have learned that volatility is something we need to embrace to be successful. Eventually the market prices these events in and moves on.
Over the past 15 years a defensive 70/30 portfolio falls to the 2nd best performing, while the more middle of the road 50/50 portfolio has pulled ahead in recent years. 5/95 has lagged due to its higher exposure to global shares, which significantly underperformed between 2000 and 2010.
If you think those portfolios are volatile, then take a look at the behaviour of the asset classes (total return) that comprise them over the same time period:
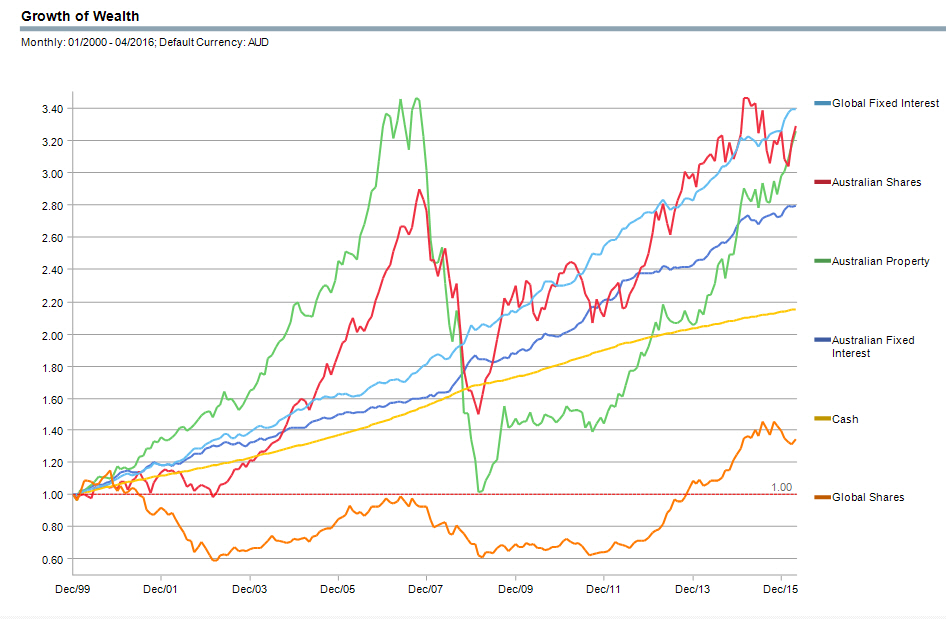
There’s a reason you don’t hitch your wagon to just one. While cash looks nice and smooth, for many investors an over-reliance on cash may well be the barrier to a comfortable retirement – in this time period the cash return lags Australian shares by over 100%. Australian shares have taken some large dips, but few could handle the extreme volatility without the buffer of fixed interest. While no one could have predicted global shares to perform so poorly for so long.
Changing strategy is something to be done when the media is printing the second set of headlines, not the first. If the retiree who wrote into AFR moved to 50% cash, by May he would have been whacked by an interest rate cut. And after chasing the illusion of safety, the funds liquidated would have surpassed their January high in May.
Selling after a drop means the likelihood of recovering from the drop is less because an investor has fewer growth generating assets and more cash that produces zero growth and barely enough income to keep up with inflation. That leaves the choice of spending less money or beginning to cannibalise an asset base that can never be replenished.
When it comes to investing the biggest risk isn’t losing money, it’s running out of it.
This represents general information only. Before making any financial or investment decisions, we recommend you consult a financial planner to take into account your personal investment objectives, financial situation and individual needs. Need help with your financial future? We think we’re Australia’s best financial advisor, click to see the reasons why.
