
Charts are a staple of finance and investing. You can tell a lot of different stories with a chart. One of the longtime favourite charts of (some) financial advisers has been the “if you missed the best days chart”.
This type of chart would show the growth of $1000 over a timeframe on a specific stock market. Over 15, 20 or 25 years. Maybe if someone was invested over the whole 20 years their money could grow to $6,000, miss the best day and their money only grows to $5,850. Miss the best five days and their money only grows to $5,500 etc.
Essentially you keep knocking off the best few days of market returns, and your potential return would get smaller and smaller. The story being told is the value of staying put. You never know when the good days are coming, so there’s no point jumping in and out of the market trying to time when the good and bad will arrive. And if you jump out, you may miss a recovery.
Some of the more cynical beasts in the advice community would sometime rail about the chart. Suggesting that it also ignores some other stories. What about if you missed the worst days, how much better would the chart look like then! There was another argument that some of these best days are around the worst days, so they’re really just offsetting the best days! Finally, all these days are just random, so the odds of missing them is very unlikely.
Yes, someone certainly could create a “miss the worst days” chart, if that’s their angle. There are a few of those charts floating around, but it wasn’t the point of the original chart, which was the value of staying in your seat. Trying to avoid the worst days sets a task that very few investors could achieve. On the second point, it is true: good days often show up during bad periods. Bad periods are often accompanied by relief rallies when investors think a sell off may have been too sharp so there will be a huge day where the market goes up 4 or 5%.
We’d all love to avoid those bad periods, but they often come on fast. A market may lose 10-12% in the space of 4-8 weeks. There will be a few fits and starts in there and we never know when it’s over until the market has regained that lost ground. And that regained ground will also include a few of those best days you’d rather not lose.
Then there’s the argument that all these best days are random, so if you are invested, you’re unlikely to miss them regardless. Well… occasionally, the best days won’t arrive as a response to a sell off. Those really good days will appear during a benign period or one of ongoing frustration, they will cluster together. And this is something that occurred recently.
Small Cap Rally
It’s been no secret that small caps or small companies have underperformed large companies for a few years. Recently a lot of this has stemmed from the magnificent seven of Alphabet (Google), Amazon, Apple, Meta (Facebook), Microsoft, NVIDIA, and Tesla. These companies have dominated major index returns and dragged large caps in the US, and globally, along with them.
It should be noted, this small cap underperformance isn’t a new thing. During the 2010’s the small cap Russell 2000 Index underperformed the large cap S&P 500 by 1.73% per annum. But since 2020 it’s become a substantial margin that’s blown out to 8.12% pa ending Jun 2024. Inflation and rising interest rates have played on small caps. Not surprising, as small caps are riskier propositions that may carry more debt or have higher servicing costs than established large caps.
Then this happened.

On July 9 the Russell 2000 was up less than 0.1% for the year, on July 16 it was up 11.64%. Miss those best five days and that’s nearly all your small cap return for the year. This clearly doesn’t erase the prior underperformance, but it shows how quickly segments of the wider market can respond when it’s felt their future will be more favourable. And this segment of the market has a habit of posting gains this way. Nothing, then bang!
The catalyst for this five-day rocket? The expectation of lower rates. Some market commentators have also been banging on about small cap valuations for some time now. Suggesting they’re historically undervalued compared to large companies. This difference has been apparent for a couple of years, but has continued to widen this year as the Russell 2000 went nowhere until July, while the S&P 500 was up 17%.
And this was one of the biggest concerns from the market bears. The market rally had been confined to a narrow band of large companies. They claimed it wasn’t healthy or sustainable. The small cap rally has now prompted a lot of talk about a rotation into small caps and other overlooked segments of the market. As you’d expect, many newer investors are now discovering small caps. Across the internet they’re now asking “how do they add them” to their portfolios, when their portfolios are mostly confined to large companies.
What do we think? We don’t pretend to know if this is the beginning of something or merely a short-term attempt at a catch up. Our perspective? This why you own a piece of everything. You never know when something will out or underperform. Have a portfolio that aims to capture returns where and when they happen. And diversification is never a bad thing.
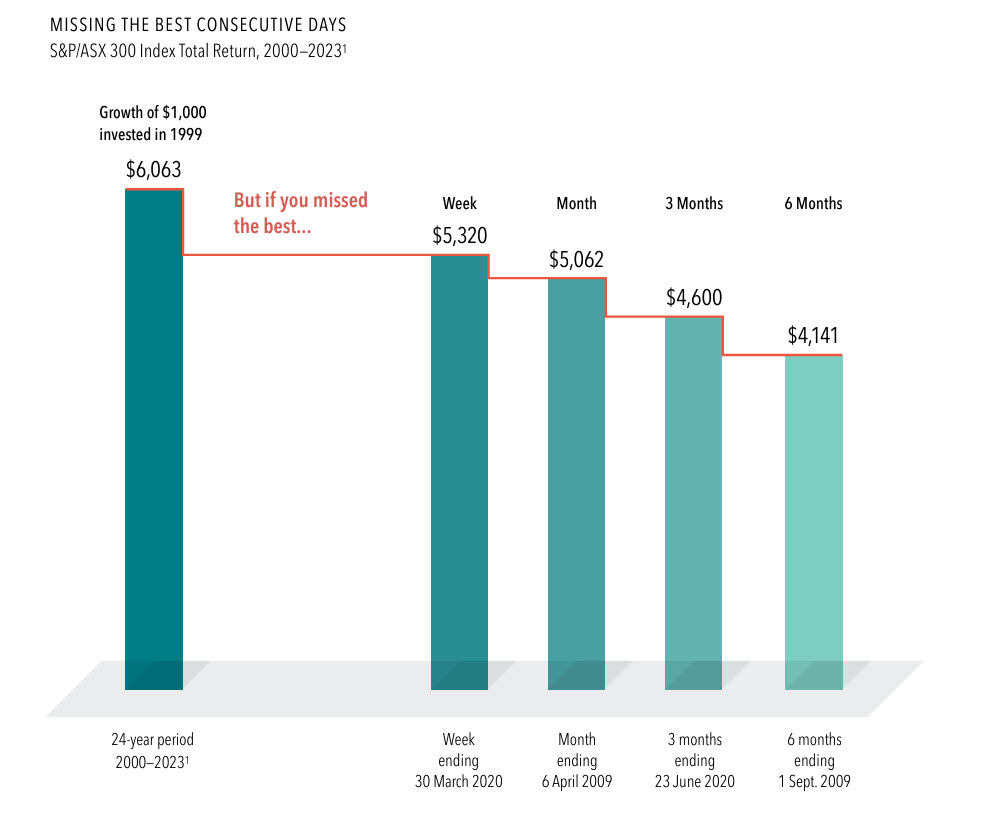
As for that best days chart, it’s now been improved. An ASX 300 example is below. It’s no longer the best random days combined together, eliminating that criticism. It’s the best week, month, 3 months and 6 months, which are easily measurable and relatable. These best periods since 2000 were during the recoveries from the global financial crisis and Covid related sell offs. Times when investors did miss the best days because they panicked, sold near the bottom, and didn’t see the recovery.
This represents general information only. Before making any financial or investment decisions, we recommend you consult a financial planner to take into account your personal investment objectives, financial situation and individual needs.