Why do financial advisers exist? Financial problems of course, and there are a lot of problems in finance!
How much to save? How to invest while balancing risk and return? How much can I spend? What returns do I need to meet my goals? What’s inflation doing? What’s everyone else doing? That one shouldn’t matter, but too often it does, and relates to another problem: behaviour.
Those are what might be termed single issue problems, but there’s one out there that manages to combine many of these problems into one: decumulation in retirement. Nobel prize winning economist, Bill Sharpe, called it the “nastiest, hardest problem in all of finance”. The reason it becomes nasty and hard, is because investors stop working and need to rely on savings. That introduces a whole manner of variables and uncertainty.
Unless that pot of savings is huge, they need to achieve a return on their savings. Equity market returns are uncertain, but over the long term they’re generally expected to be higher than bonds or cash. Can’t deal with that uncertainty? Then there’s cash, which will be certain over the short term, but often doesn’t outpace inflation and spending. Then we’re eating into our capital with an uncertain timeline ahead. Exit the workforce in our 60’s, and if in good health, there could be another 30 years ahead.
The sequence of the returns we achieve will play a role in how long our capital might last. The sequence of returns will also play a role in how we feel about future returns and our confidence. It might even influence how we spend.
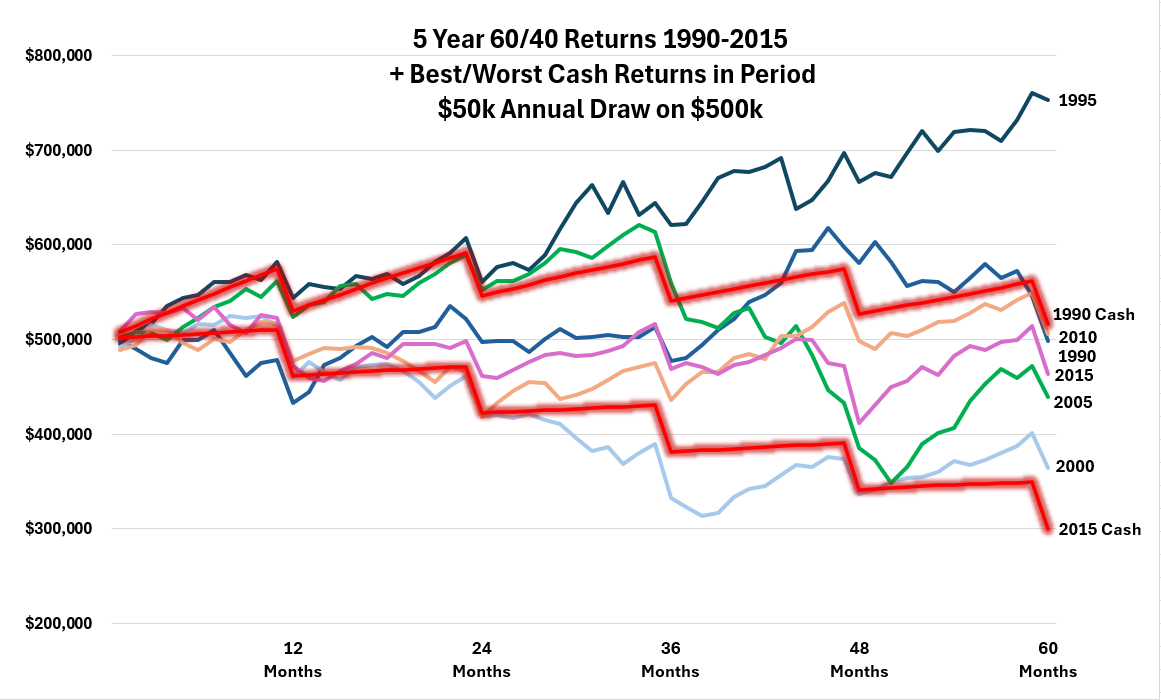
The reality of sequence of returns can be seen in the following (messy) chart.

It’s the performance of a 60/40 growth/defensive portfolio, with $500k invested, drawing a $50k annual lump sum over 5 years. The start times are spaced from 1990, 1995, 2000, 2005, 2010 and 2015. The red lines are the best and worst cash performance outcomes across those start times. This is a limited example, but it shows no two periods will ever be the same.
A $50k annual lump sum from a $500k starting portfolio is quite high, but with several of the start times the performance of the portfolio would have just been strong enough to maintain the initial sum after $250k being drawn over 5 years. In one instance, being the 1995 start date, it would be hard not to be overconfident after starting with $500k, drawing $250k, and having $753k left!
What do the cash returns tell us? With the best one being 1990 it’s enough to keep the principle intact on a high draw, but the worst in 2015 is eating into the principle at a high rate. It’s a reminder an investor may be able to hold more cash during periods of high rates, but when rates are low, they need to be prepared to accept market risk or their portfolio may go into a death spiral.
The 2000 start date is in something of a death spiral itself. At the end of 5 years, 27% of the initial capital is gone. It would be hard to be confident after eating into your capital like that. In this instance, the 2000 worst followed the 1995 best. So the sequence of those returns would have meant the early confidence from the 1995 start was then tempered by the next five year period.
If we then add on the 2005 start period to extend this out to 15 years, it now includes the GFC, and that’s an even rougher sequence of returns. But that strong first five years, starting in 1995, would have ensured the portfolio finished only marginally below the $500k start point after pulling out $750k over 15 years. Showing a portfolio is much better able to withstand an underwhelming sequence of returns, as long as it gets off to a strong start.
It’s also better able to withstand an underwhelming sequence of returns if the investor has the ability to be flexible.
It’s what you might call the Peter Ponzo principle. Ponzo, a maths professor at the University of Waterloo in Canada, retired in the early 1990’s, and took half his university pension in an annuity at 9.1% pa (on his wife’s advice). With the other half he chanced his arm as a stock picker, thinking he could do better, but admitted investors were probably better off sticking with index funds. Ponzo wrote online about his ups and downs, until he passed in 2020.
As Ponzo said about his sequence of returns, “If we have a good year, we take a trip to China…if we have a bad year, we stay home and play canasta.” The point being, if investors are able to regulate their spending, they can ride out those poor years much more easily. A lot of years the Ponzos were staying home playing Canasta, due to a poor sequence of returns, but they still lived comfortably due to locking in that annuity.
Which highlights it’s valuable to have a built-in safety net. Something Australians post 67 can rely on: the age pension. While it is means tested, if an investor runs into a poor sequence of returns or draws down on their capital, they can be assured that the government safety net is there. This may allow them to make bolder spending choices or be less conservative with their portfolio. All with the knowledge there’s a bed of feathers somewhere below.
But that’s why we have an adviser: to model all these variables. Let them worry about the nastiest, hardest problem in finance.
This represents general information only. Before making any financial or investment decisions, we recommend you consult a financial planner to take into account your personal investment objectives, financial situation and individual needs.
Data: 60/40 From 1/1990. Constructed under AUD. Period 1: From 1/1990 (Earliest) To 12/1998 Rebalance: Per 12 Months. Bloomberg AusBond Bank Bill Index 2.00%, Bloomberg Global Aggregate Bond Index (hedged to AUD) 10.0%, MSCI World ex Australia Index (net div., AUD) 15.7500%, MSCI World ex Australia Index (net div., hedged to AUD) 15.7500%, S&P/ASX All Ordinaries Index (Total Return) 24.00%, FTSE World Government Bond Index 1-3 Years (hedged to AUD) 8.00%, MSCI Emerging Markets Index (gross div., AUD) 4.500%
FTSE World Government Bond Index 1-5 Years (hedged to AUD) 20.0%. Period 2: From 1/1999 To 10/2024 (Latest) Rebalance: Per 12 Months. Bloomberg AusBond Bank Bill Index 2.00%, Bloomberg Global Aggregate Bond Index (hedged to AUD) 10.0%, MSCI World ex Australia Index (net div., AUD) 15.7500%, MSCI World ex Australia Index (net div., hedged to AUD) 15.7500%, S&P/ASX All Ordinaries Index (Total Return) 24.00%, FTSE World Government Bond Index 1-3 Years (hedged to AUD) 8.00%, MSCI Emerging Markets Index (net div., AUD) 4.500%, FTSE World Government Bond Index 1-5 Years (hedged to AUD) 20.0%


