Well, there it is. The correction that we’ve been told has been coming every month since January 2017, finally arrived. Over? Probably not, but it was needed.
Needed?
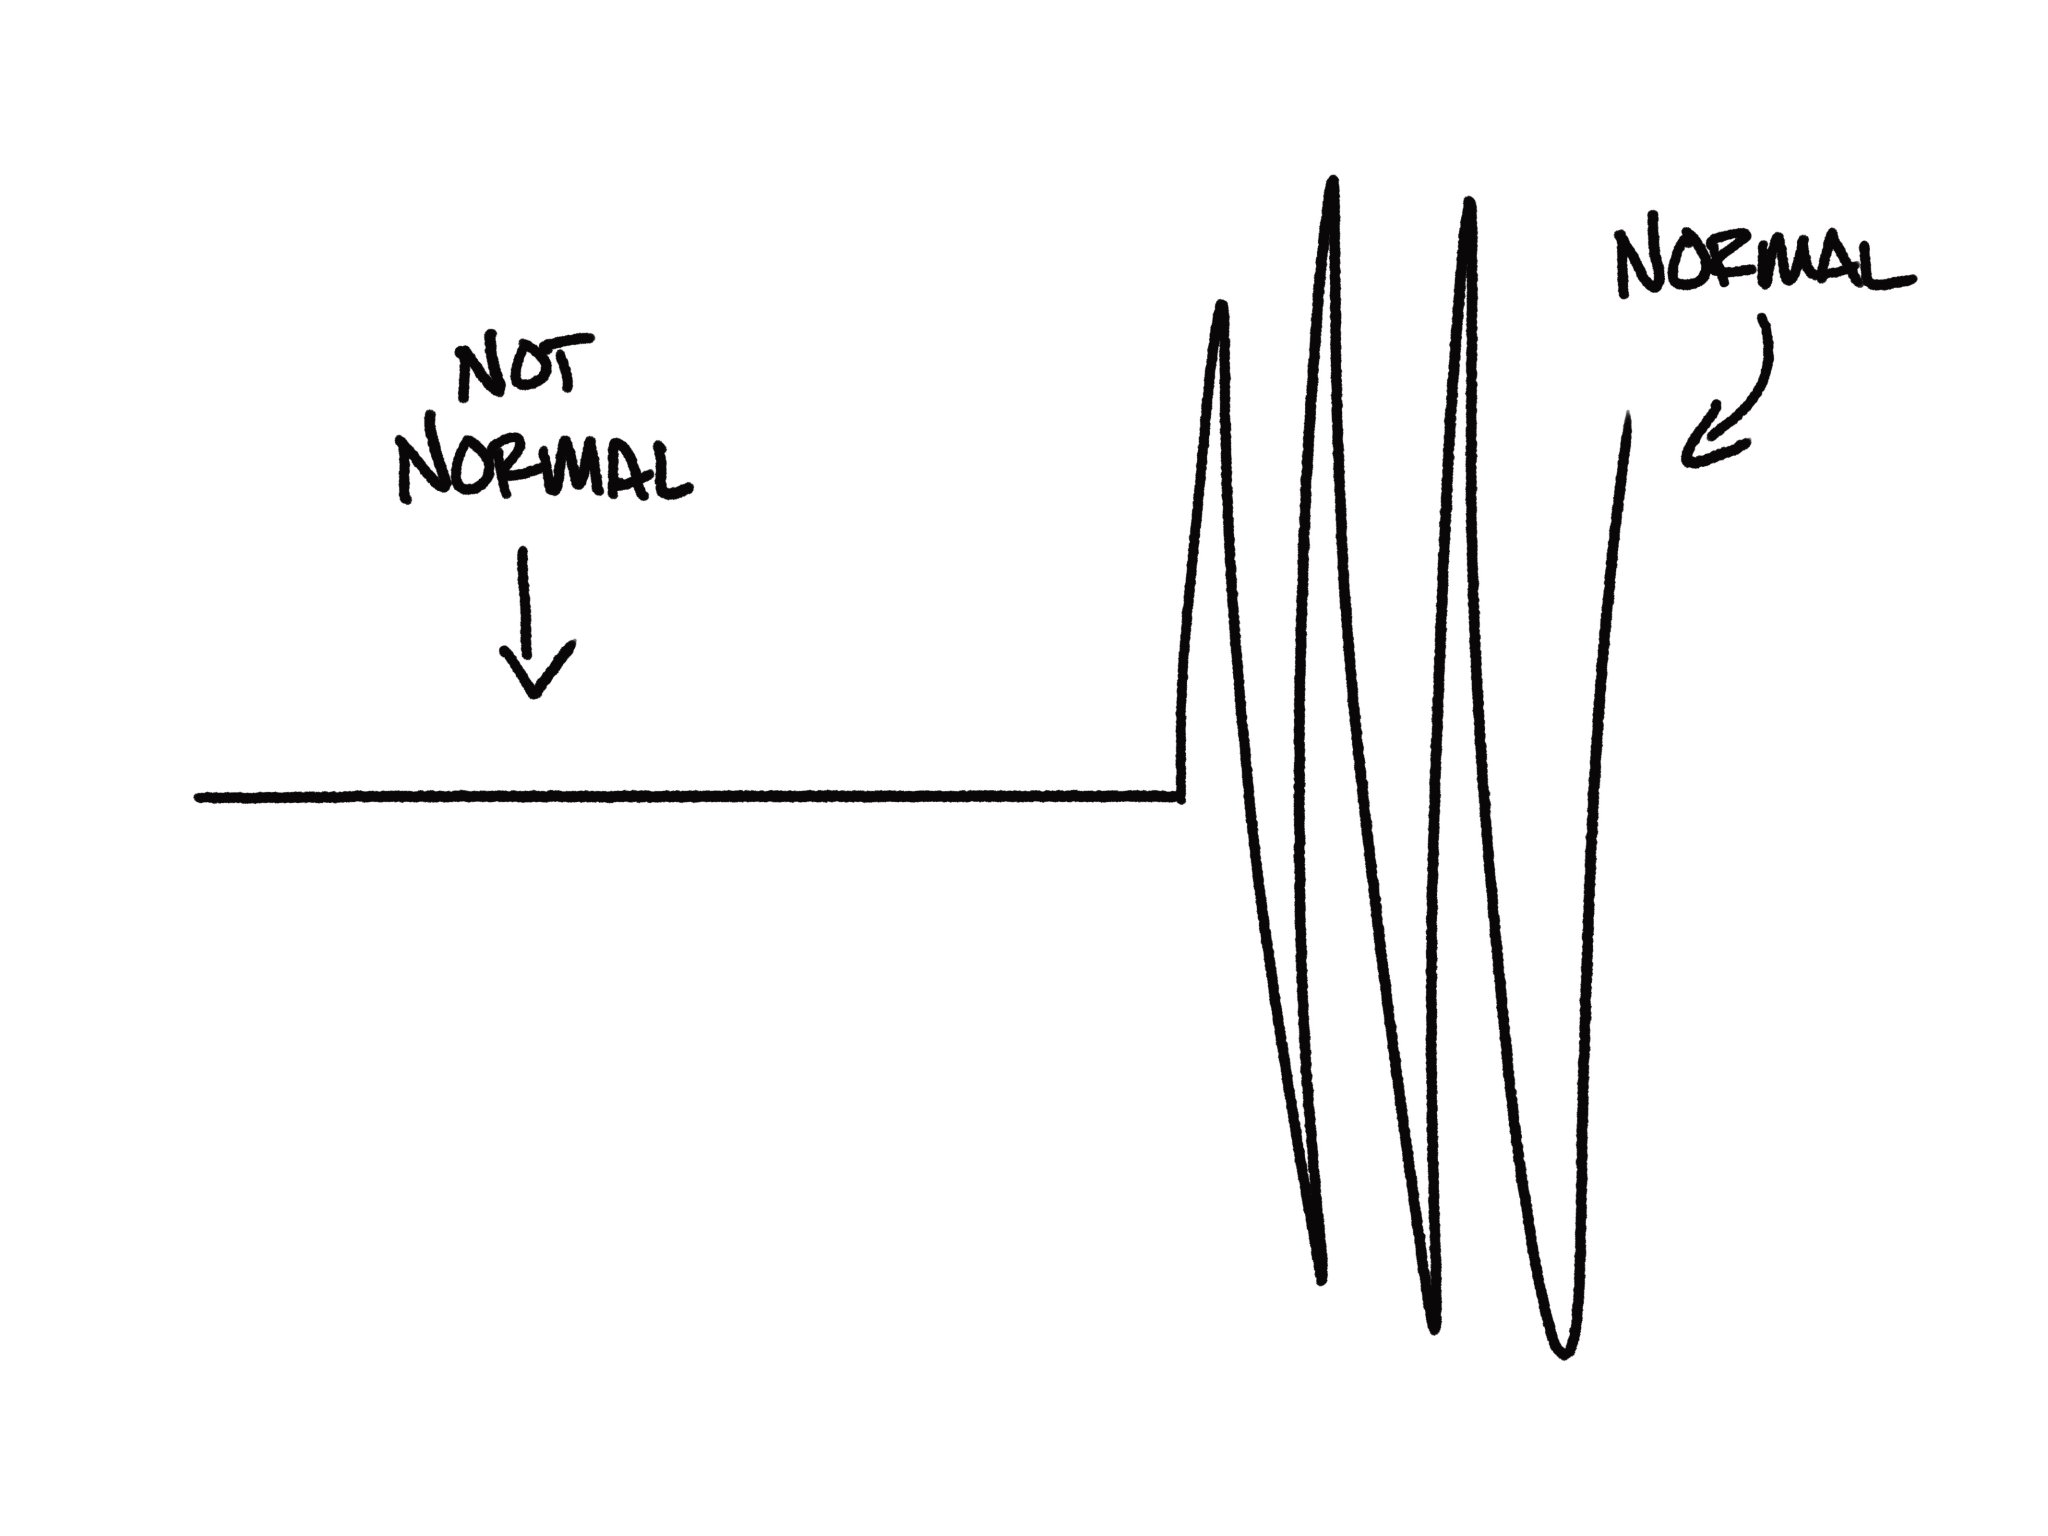
Yes needed. Nothing in life comes for free. 2017 was an extremely rare year where the entrants enjoyed a free pass to the park and none of the rides had any bumps, jumps or scares. The biggest decline happened early in 2017 and then equity markets happily chugged upwards.
How should you deal with this correction? Ignore it. Like all downward movements there are the regular tea leaf readings, inferences about past crash behaviour being an indicator of the future along with the unveiling of scary stats and charts reminding us of uncharted territory. In other words, we’re expected to believe it’s eerily similar to 1987, 2008 and the great depression, but it has the possibility to be much worse!
Last Friday’s fall on the Dow Jones was 665.75 points. Rounding up it’s was 666 – the devil’s number and apparently to some that was a harbinger of hell about to be unleashed. Unlikely. Tuesday’s fall was 1175 points and to put the fall in some sort of perspective, the Dow Jones wasn’t even worth 1175 points until April 1983. 35 years later the whole weight of that index is a 4.6% loss daily loss!
Could a correction become a bear market or a crash? Always possible. However, time has shown almost no corrections go further to become crashes. Given enough time, most turn into buying opportunities.
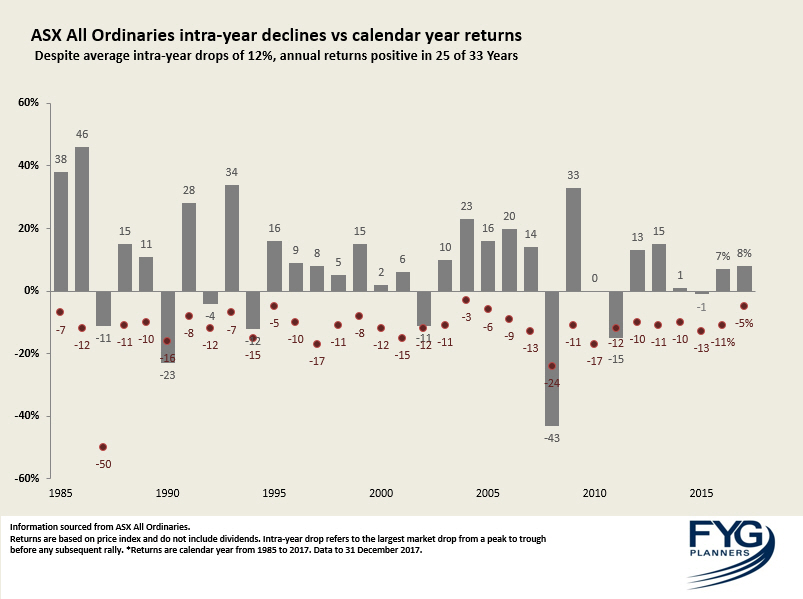
As one of our favourite charts shows (now updated through end 2017), on average the ASX portion of a portfolio will get bashed downwards 12% every year, but 75% of the time (since 1985) you’re still getting a positive return for the year. In addition you can expect three 5% declines in any year.

It’s usually a recession that sets off serious bad times in equities. So why are sharemarkets tumbling when we have the opposite economic conditions in the world’s biggest economy? It’s because investors are starting to realize what that growing economy means – inflation and more interest rate hikes.
Rates fell to historic lows in the financial crisis and have only recently started to rebound. Low rates make investors turn away from fixed interest and cash to embrace shares. With rates rising, shares become less attractive. At the same time, an expanding economy means companies can expect greater long-term growth and corporate profits remain robust. While President Trump’s giant corporate tax cut hasn’t even worked its way into the equation yet.
As usual, if the rough times aren’t over, don’t sell the good stuff that have served you well in hopes of avoiding market carnage. If you are inclined to, remember there is no way you’ll know when to buy again. Despite a correction often being the best time to buy, most investors don’t have the fortitude to don their floaties and enter the choppy water to grab a bargain.
As for the headlines, you’ll note they still haven’t become more inventive: “50 billion wiped off the market”. While we’re still waiting for “50 billion wiped on the market”. And while the market falls led the news on Tuesday, during 2017 the US markets had 12 consecutive months of gains and Australia had 10 positive months. Reporting on any of this good stuff was still relegated to the business section.
It’s partially why we feel the loss more than the gain. Though the downside happens significantly less, it’s afforded significantly more attention.
Last year was an anomaly. Now it’s normal programming.

Picture Credit: behaviorgap
This represents general information only. Before making any financial or investment decisions, we recommend you consult a financial planner to take into account your personal investment objectives, financial situation and individual needs.


